Nonprofit Financial Hub

Prime Interest Rate in Commercial Property Loans
A 0.25% bump can sting your cash flow. We demystify prime (the benchmark banks use), how it’s set, and how lenders price CRE (commercial real estate) loans off it, so your nonprofit can forecast payments, compare offers, and lower the spread you pay. Check options in under 20 minutes, no upfront costs.
The number that moves your payment more than any other
As you check your options, remember one thing can swing the outcome overnight: prime. Your board is ready to approve a $5M facility loan at prime + 1.75%. Prime ticks up 0.25% the week of the vote, and the interest-only draw jumps about $1,042 per month. Your DSCR (debt service coverage ratio: cash flow divided by annual debt payments) slips from 1.23x to 1.18x. The bank’s minimum is 1.20x. Approval stalls, even though your project didn’t change.
Different angle: you’ve bid the renovation and timed your capital campaign. The construction loan budgets interest at prime + 1.75% over 12 months with an average $3M outstanding. Prime jumps 0.50% before closing, adding roughly $1,250 per month in interest and about $15,000 to interest-during-construction (IDC, the interest you pay while building). That narrows campaign headroom and nudges LTV (loan-to-value: loan size divided by project value) from 72% toward 75%, the bank’s next pricing tier.
So what exactly is the prime rate, who decides it, and why do most borrowers pay prime plus a spread? We’ll translate the jargon next.
 Prime rate 101: what it is and where it comes from
Let’s answer that question: prime is the rate banks quote to their most creditworthy business customers. Most lenders reference WSJ Prime (Wall Street Journal Prime, a survey of major banks’ posted prime rates) as the benchmark. It tends to move with the Federal Funds Rate (the overnight rate targeted by the Federal Open Market Committee, or FOMC), usually in 0.25% steps. When the Fed shifts, prime typically follows within a day or two.
Prime isn’t set by the government; it’s a market consensus that banks publish and the WSJ compiles. Your loan may be variable (payment adjusts as prime changes) or fixed (rate set off a different benchmark). Many variable loans recalc monthly or quarterly and may include a floor (a minimum rate) even if prime drops. So prime is the base number. Your final price is prime plus a spread, plus fees.
Lenders start with a benchmark, Prime, SOFR (Secured Overnight Financing Rate, a money-market index), or Treasuries (U.S. government yields), then add a risk-based spread for your deal. That spread reflects credit, collateral, and structure. Prime + spread + fees = your all-in rate.
For nonprofits, underwriting zooms in on revenue mix (earned vs. contributed), donor concentration, grant timing, and unrestricted reserves. Strong auditeds, recurring gifts, and diversified support can tighten the spread. Heavy reliance on one grant or slow reimbursements can widen it.
As you plan broader nonprofit funding, we’ll align structure with grant schedules, pledges, and reserve policies.
Why most borrowers pay above prime
Spreads widen or tighten based on collateral type, LTV/LTC (loan-to-value/loan-to-cost), DSCR (debt service coverage ratio), borrower strength, recourse, tenant/donor mix, and project stage. Example: A stabilized building at 60% LTV with 1.50x DSCR and full recourse might price at prime + 200 basis points (2.00%). The same collateral at 75% LTV, 1.20x DSCR, and partial recourse could price at prime + 300 bps (3.00%). On a $1,000,000 interest-only balance, prime + 3.00% vs. prime adds $2,500 per month and $30,000 per year. That’s real program money.
Consider amortization: On $1,000,000 over 20 years, moving from prime + 2.00% to prime + 3.00% raises monthly payments by roughly $600 and adds about $7,200 per year. Improve DSCR from 1.15x to 1.30x, trim LTV from 75% to 65%, and offer partial recourse, your spread can tighten 50–100 bps. That’s $300–$600 less per month per $1M. Small underwriting wins compound.
Nonprofit nuance matters. Documented pledge reliability (multi-year history and aging), signed grant award letters, and clear reimbursement timelines reduce perceived risk. Seasonal donations without reserves, or heavy dependence on a single gala, can push spreads wider. Separate restricted from unrestricted funds in reporting, and show 12–24-month cash forecasts to strengthen the case.
To compare quotes cleanly, you need a simple framework that breaks pricing into benchmark, spread, and fees, across Prime, SOFR, and Treasuries. Next, we’ll map that out so you can spot costs and pitfalls at a glance.
 What shifting prime does to your deal math
When prime moves mid-process, three pinch points pop up fast. We see them on bridge loans, lines of credit, and construction financing. Here’s what usually bites timing, approvals, and budgets when that quarter-point shows up.
- Step 1: Rate lock pressure: Floating quotes or expiring locks reprice with prime, bumping monthly payments and forcing choices on scope, timing, or reserves.
- Step 2: Coverage squeeze: NOI (net operating income) holds steady while debt service rises, tightening DSCR and triggering smaller proceeds, collateral, or a re-trade.
- Step 3: Budget ripple: Interest carry during construction or lease-up climbs, pressuring contingency, stretching campaign cash, and forcing scope changes or value-engineering.
To regain control, compare benchmarks and spreads side by side. In the next section, we’ll show a simple framework, Prime vs. SOFR vs. Treasuries, so you can price options quickly and avoid hidden cost traps.
Make sense of benchmarks and typical spreads
You asked for a side-by-side, here’s the simple matrix we promised. It compares the common benchmarks, how each is set, and the typical spread ranges you’ll see so you can decode any quote fast.
| Benchmark | Typical Users | Rate Mechanics | Typical Borrower Spread (bps) | When You See It |
|---|---|---|---|---|
| WSJ Prime (Wall Street Journal Prime) | Banks and credit unions; SBA-linked products | Set off federal funds rate via bank surveys; tracks Federal Reserve moves | ~200–450 basis points over index | Bank balance-sheet loans; smaller commercial real estate; Small Business Administration (SBA) pricing |
| SOFR (Secured Overnight Financing Rate), term / compounded | Banks and non-banks using floating-rate products | Repurchase (repo) market index; reflects secured overnight borrowing costs | ~225–500 basis points plus credit add-ons / adjustments | Construction loans; bridge financing; transitional assets |
| U.S. Treasuries (5–10 year) or interest rate swaps | Life companies, agencies, and commercial mortgage-backed securities (CMBS) lenders | Fixed-rate base from Treasuries / swaps; lender adds spread | ~150–350 basis points over the base | Stabilized properties; longer fixed periods; permanent debt |
| Hybrid/Other: prime-to-fixed, rate caps, swaps | Banks and specialized nonprofit lenders | Start on prime/SOFR, then add a swap or a rate cap | Varies by structure, hedge, term, collateral, and recourse | Tailored risk management when you need payment certainty |
Ranges vary by property type, borrower strength, leverage, and market liquidity. Your reserves, pledges, and DSCR (debt service coverage ratio) shift spreads. Next, we’ll turn those basis points into monthly dollars for your budget.
From rates to payments: what each 1% means
As promised, let’s turn those basis points into dollars. Below are illustrative monthly payments per $1,000,000 at common rates, both interest-only and 25-year principal-and-interest, so you can budget and brief your board quickly.
| Headline Rate | Monthly IO per $1M | Monthly P&I per $1M (25-yr) | Comment |
|---|---|---|---|
| 6% | $5,000 | ~$6,440 | Typical of lower-spread, well-qualified fixed loans |
| 8% | $6,667 | ~$7,720 | Rising rates tighten DSCR (debt service coverage); watch proceeds |
| 10% | $8,333 | ~$9,090 | Higher carry during lease-up or construction |
| 12% | $10,000 | ~$10,530 | Stress-test at this level for resiliency |
Example: if prime is 7%, prime + 300 bps = 10%; prime + 200 bps = 9%. On $1M interest-only, that 1% gap costs about $833 per month. On 25-year amortization, expect roughly $800–$1,100 more per month, depending on structure.
Seven ways to lower the rate you actually pay
That $833 per month isn’t fixed, you can pull levers to bring it down. These practical, lender-aligned moves fit nonprofit realities and can trim 25–100 basis points from your spread. It’s doable.
- Strengthen DSCR: Raise revenue or trim costs to lift DSCR (debt service coverage) to 1.25x+. Pre-sell sponsorships, adjust fees, sublease space, cut nonessential spend.
- Right-size leverage: Bring LTV/LTC (loan-to-value/loan-to-cost) down 5–10 points with extra equity, pledges, or phased scope. Lower leverage trims spread tiers and preserves proceeds.
- Tighten budgets: Lock hard bids, require two–three vendor quotes, and carry 7–10% contingency. Fewer change orders mean less interest carry and a lower risk premium.
- Shorten risk windows: Phase construction, set milestone draws, and pre-lease or pre-subscribe programs. Faster stabilization shortens exposure, lowering the construction/lease-up premium the lender bakes into spread.
- Collateral and guarantees: Offer additional collateral, springing liens, or limited personal/board guarantees. Pledge receivables or investment accounts to reduce LTV and tighten spread without cash drain.
- Benchmark choice: Compare prime vs SOFR (Secured Overnight Financing Rate). Cap SOFR for guardrails, or choose prime if simplicity matters more than base-index savings.
- Paper trail wins: Share auditeds, year-to-date financials, grant letters, pledge schedules, and reimbursement contracts. Clean documentation reduces risk in underwriting and wins tighter spreads and covenants.
If you’re still shaping scope and need early-stage dollars, explore Pre-Development Financing to cover soft costs before the main construction facility.
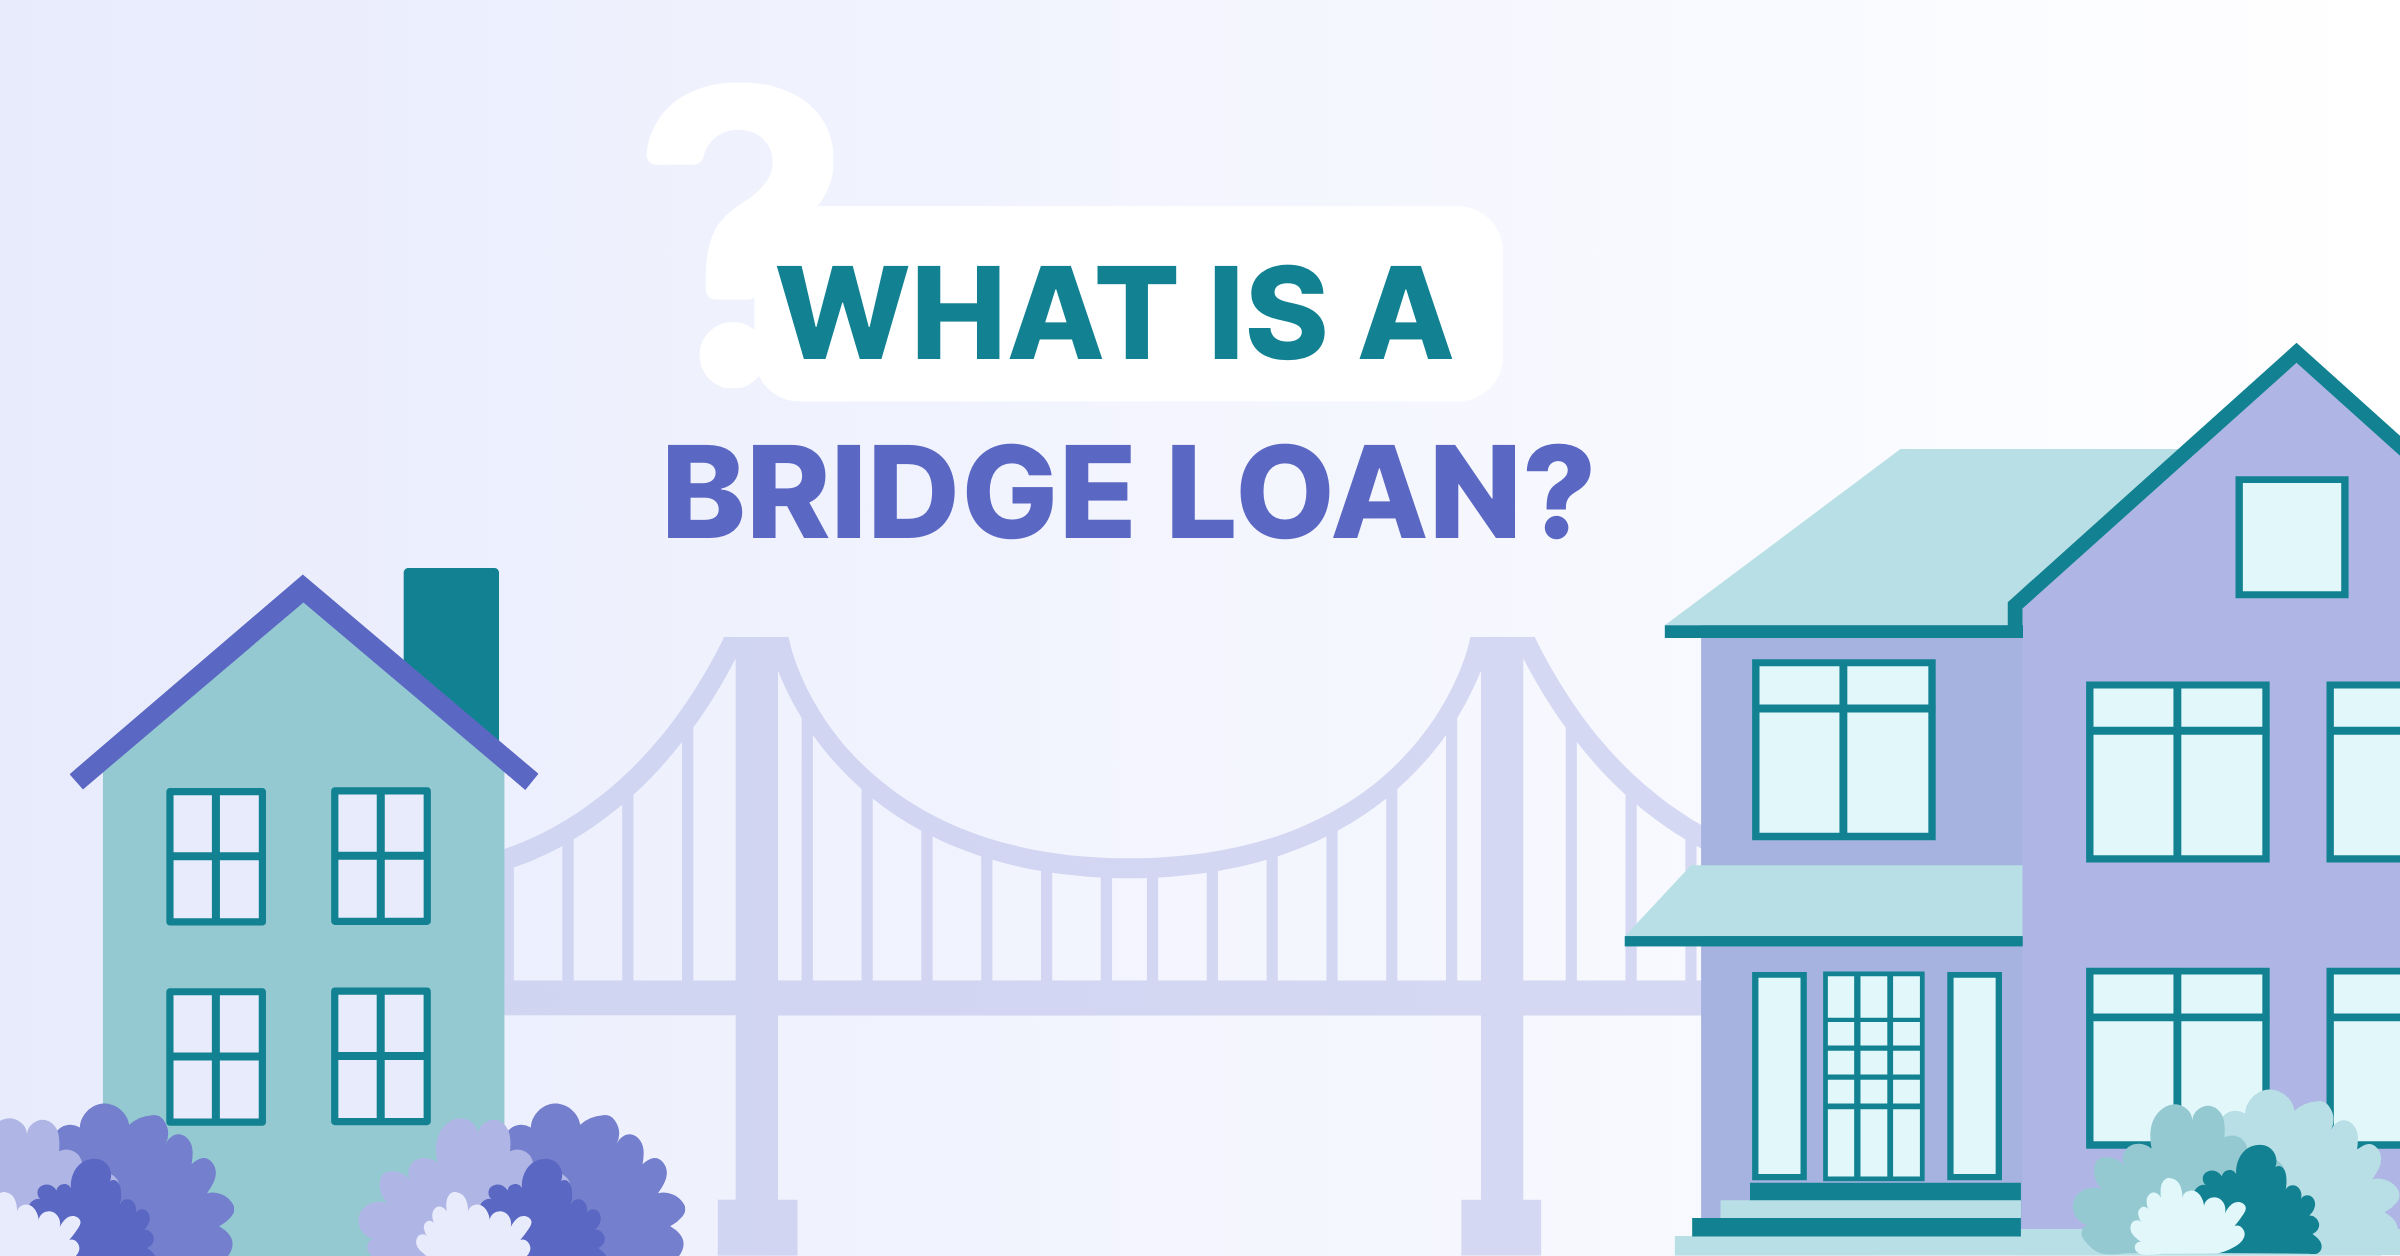
Bridge financing to keep momentum
If pre-development dollars cover planning, short-term liquidity keeps you moving when timing slips. Use a simple bridge to span award-to-disbursement gaps on grants and pledges, fund cost overruns or change orders, and carry interest, payroll, or vendor deposits until permanent financing closes. Example: July grant award, October disbursement, 90 days of working room protects your project schedule and board commitments.
For context, see our bridge loan category overview with use cases, timelines, and pricing basics.
Ready to move? Review Bridge Loans for Nonprofits for amounts, documents, and a quick pre-qual.
- Pro: Fast approvals and flexible draws protect timelines and vendor commitments.
- Pro: Close now, refinance later to lock better permanent terms when rates or covenants improve.
- Watch: Carry costs add up; require a defined exit, grant disbursement, pledge collections, or permanent financing takeout.
Lines of credit for nonprofit flexibility
Once your bridge has a defined exit, you still need a safety valve for daily cash flow. A revolving line smooths grant and donation timing so payroll, programs, and facilities stay on track. Draw for a 2–3 week reimbursement delay, a seasonal donor dip, or a surprise roof repair; repay as gifts land. When you’re ready to renovate or expand, we’ll pivot to project financing.
Learn how a line of credit works, what it costs, and when to use it, examples, pros/cons, and budgeting tips for nonprofits.
Ready for specifics? See our nonprofit line of credit amounts, required documents, and fast application, pre-qualify in under 10 minutes with no upfront costs.
Build and expand with confidence
Moving beyond a line of credit into a renovation or new facility, the financing shifts. Construction loans price build risk: funds arrive in draws, you pay interest-only on what’s disbursed, and lenders test stabilization before takeout. Permanent loans price stable cash flow: typically fixed or longer-term variable, fully amortizing, after the building and budget settle. Build periods often span 12–18 months.
Explore construction financing for nonprofits: construction-to-perm, mini-perm with later refinance, or fixed-perm. Expect interest-only during build and monthly draws, then convert to longer-term debt once stabilized.
Lenders scrutinize cost discipline and contingencies because overruns push LTC (loan-to-cost) higher and squeeze DSCR (debt service coverage ratio). Tight bids, realistic schedules, and a 7–10% contingency protect coverage. We’ll show how these ratios drive proceeds and compliance in the ratios section.
Tailored options for your mission
Those ratios you just saw play out differently in healthcare. Your payer mix (Medicare/Medicaid/commercial) and 45–120-day reimbursement lags drive DSCR (debt service coverage ratio) and liquidity, while CON (certificate of need, the state’s approval to add beds or services) and large-cap equipment cycles affect collateral and timing. We structure flexible draws and interest-only periods with hospital loans so you can bridge claims, fund equipment, and stay compliant.
For congregations, attendance trends and giving stability shape terms. We underwrite multi-year pledge reliability, weekly giving patterns, and rental income from multipurpose spaces (gym, classrooms, daycare) to smooth seasonality. If attendance is steady and 70%+ gifts are recurring, spreads tighten. Our faith based loans match cash cycles with interest-only windows and simple covenants. Next, we’ll show you how to compare offers apples-to-apples.
How to compare offers tied to different benchmarks
As promised, we built an apples-to-apples checklist to normalize Prime, SOFR (Secured Overnight Financing Rate), and Treasury-based quotes. Use it to brief your board, sidestep hidden costs, and prep for the key ratios next.
- All-in rate: List index (Prime/SOFR/Treasury) + spread + fees; note any floor or cap and payment reset timing.
- Structure: Fixed or floating, reset period (monthly/quarterly), and prepayment terms, soft call, make-whole, or yield maintenance; include any step-downs.
- Amortization & IO: Years to amortize, interest-only period, and refinance assumptions (timing, costs, target rate) so debt service projections stay realistic.
- Proceeds math: Show LTV (loan-to-value), LTC (loan-to-cost), DSCR (debt service coverage) drivers, plus any holdbacks, interest reserves, or escrowed contingencies that reduce day-one dollars.
- Covenants & tests: DSCR (coverage) triggers, re-margining (paydown if ratios slip), liquidity thresholds, reporting cadence; note cure rights, grace periods, and any material adverse change language.
- Fees & timing: Origination, legal, appraisal, underwriting, third-party reports; estimate closing cash needed, draw timelines, and rate-lock window/extension costs with deadlines.
What lenders watch when rates rise
You’ve tallied fees and lock windows, now check key ratios under a rate bump. DSCR (debt service coverage ratio: operating cash flow divided by annual debt payments) falls as rates rise; that can cut loan proceeds. Debt Yield (NOI divided by loan amount) doesn’t move with rate, but proceeds set by DSCR can push it above a lender’s 8–10% minimum (e.g., DSCR 1.25x → 1.21x on $1M interest-only).
Evaluate the Loan to Cost Ratio (LTC): loan amount divided by total project cost. Rising costs or trimmed proceeds can push LTC past a 70–80% cap and force scope or equity changes.
Rule of thumb: model base rate +100 bps and a 10% NOI haircut. Aim for DSCR ≥ 1.20x and LTC ≤ 75% under stress. If either breaks, adjust scope, add equity, or stage phases before requesting term sheets.
Get terms built for nonprofits
If your DSCR or LTC breaks under stress, we’ll help you restructure and fund fast. Nonprofit-focused underwriting, up to $10M, no upfront costs, and a simple application you can finish in about 10 minutes. Clear terms, quick answers.
Explore our nonprofit financing solutions and get matched today.
Need funding this month? Go straight to Bridge Loans for Nonprofits for fast approvals and clear takeouts.
Start Your 10-Minute Application
Prime interest rate FAQs
Before you tap Start Your 20-Minute Application, here are concise, practical answers. We don’t quote live rates here, ask your lender for today’s numbers. Use this to prep your board and compare offers without the jargon.
What exactly is the prime rate, and who decides when it changes?
Prime is the reference rate many banks post for top business borrowers. The Wall Street Journal surveys major banks to publish WSJ Prime, which typically moves in step with Federal Open Market Committee (FOMC) policy shifts. Changes often occur in 0.25% increments and show up on or shortly after FOMC decision days. Lenders then price your loan as prime plus a risk-based spread.
Why is my quoted rate higher than prime?
Because your price is benchmark + spread + fees. The spread reflects risk: leverage, collateral strength, cash-flow predictability, liquidity/reserves, management, and structure. Example: stronger DSCR (debt service coverage ratio) and 65% loan-to-value can trim 25–100 basis points. Your leverage is documentation, clean auditeds, current financials, grant awards, pledge schedules, and realistic budgets reduce perceived risk and tighten the spread.
Is it better to price off prime, SOFR, or Treasuries?
Prime is simple and common for lines of credit; watch for rate floors. SOFR (Secured Overnight Financing Rate) often starts lower but is more technical; you can add a cap for guardrails. Treasuries (U.S. government yields) anchor fixed rates, good for long-term certainty. Choose based on volatility tolerance, project duration, and whether you’ll hedge, cap, or refinance.
Should nonprofits choose fixed or floating in a rising-rate market?
Start with mission stability. If your programs and payroll need predictable cash outlays, fixed or capped floating often wins. Many nonprofits blend: float during construction, then fix at stabilization with step-down prepayment (fees that decline over time) for flexibility. Remember, every 25 bps (0.25%) is about $208/month per $1M interest-only, set guardrails and consider caps.
Disclaimer:
All examples, case studies, timelines, and cost calculations in this article are illustrative only and are not guarantees of terms, pricing, approval, or funding speed. Actual financing structures, interest rates, fees, and timelines depend on the borrower’s financial condition, documentation, collateral, and other underwriting factors. This content is provided for educational purposes and does not constitute financial, legal, or investment advice.